Here at Digital Citizen, we review many wireless routers and mesh WiFi systems. In our reviews, we analyze the wireless spectrum in our area, so that we understand how the wireless signal evolves and how capable the device that we are reviewing is. In the past, we used several tools for this task. Some used to be free but now have become rather expensive. Recently, we switched to NetSpot, and we enjoy using it. Here is why this app is one of the best wireless spectrum analyzers on the market, and why we will use it in all our future reviews of wireless routers, and other system devices:
NOTE: We reviewed NetSpot 2.8.1.600, both in the free and Pro version.
NetSpot: Who is it good for?
NetSpot is an excellent choice for:
- Home users that want to improve their wireless network settings and coverage
- Users who need a free solution for basic WiFi analysis
- IT professionals who need to perform advanced analysis and troubleshooting for WiFi networks
- Users who need a tool with an affordable price for advanced WiFi analysis
Pros and cons
There are many good things to say about the NetSpot:
- It is free to use for basic WiFi analysis
- Easy to download, install, and use, both for beginners and advanced users
- It is not mandatory to provide personal data to use the product for free
- It provides all the data you need to understand what is going on with the WiFi in your area
- It includes many visual tools and charts, for improved visualization of the wireless spectrum
- Its pricing is more affordable than that of other similar products
We loved using NetSpot, and the only downside we could find is that its user documentation is available only online.

Verdict
NetSpot is an excellent tool for analyzing the wireless spectrum in your area, and for troubleshooting problems. If you want to configure your WiFi as optimally as possible, you should at least make a quick analysis with the free version of the app. NetSpot is easy to use, both for beginners and advanced users; it offers lots of data and, when you need to purchase a Pro license, the cost is smaller than that of similar products. We highly recommend it to all our readers.
Using the free version of the NetSpot app
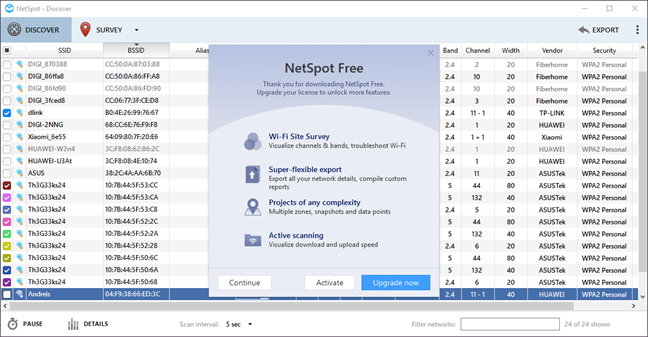
Downloading NetSpot and installing it, is a straightforward process. While NetSpot asks you to enter an email address to join their newsletter, that is not a mandatory step, and you can download NetSpot for free, without providing any personal information. NetSpot is available both for macOS X and Windows. When you run the free version, you are informed each time about what you get from upgrading to the paid PRO version. Click or tap Continue, and you can use the app and its main features.
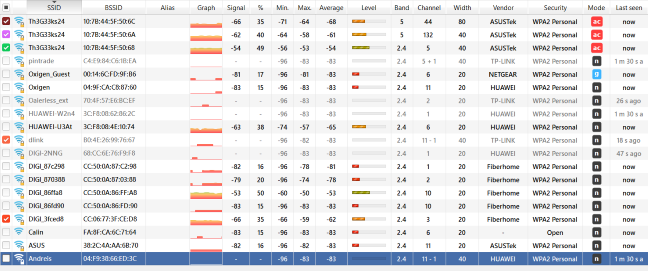
The free version of NetSpot is a great app for analyzing and visualizing the wireless spectrum in your area. For each WiFi network in your zone, you see:
- its SSID or the network name
- the MAC address of the router or wireless access point that is emitting the signal
- the alias of the network (if you set it in the app)
- a graph with the signals strength history
- the current signal strength measured in dBm, the minimum, maximum and average signal, the level of the network signal
- the wireless band on which signal is emitted, the channel used, and the width of the frequency channel (20, 40 or 80 MHz),
- the vendor of the device emitting the wireless signal
- the security used or the type of encryption
- the wireless mode or the standard used for the network: 802.11ac, 802.11n, etc
- when the network was last seen in your area.
If you do not understand all the technical terms used by NetSpot in its default view, you can check this dictionary: All the clever words used in NetSpot and Wi-Fi related science explained. This takes us to the only minor negative of this app: its user documentation is available only online. Also, some of it references older versions and features of NetSpot, which may be confusing to some users.
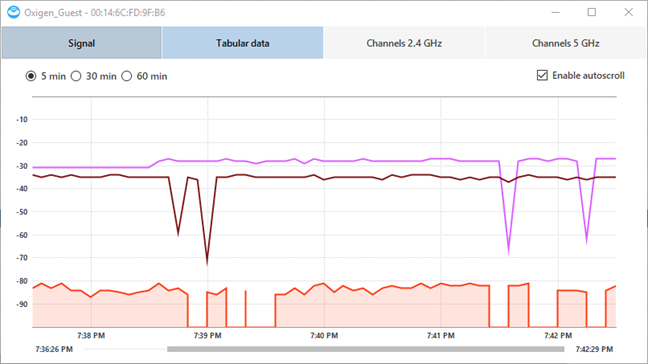
When you double-click or a wireless network, you get access to other types of data. First, you can see a graph with the evolution of its signal strength, and compare it with that of other networks, in your area.
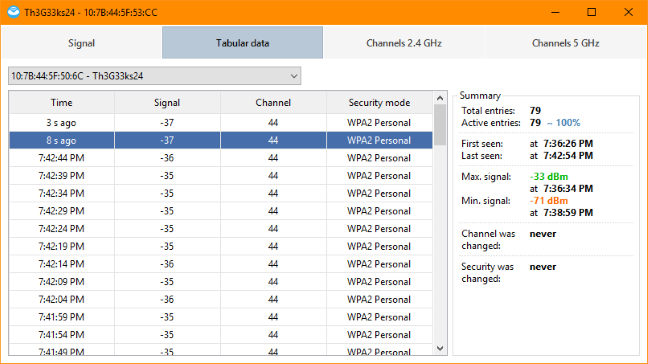
You can also see the same data in text form, with a new measurement every five seconds.
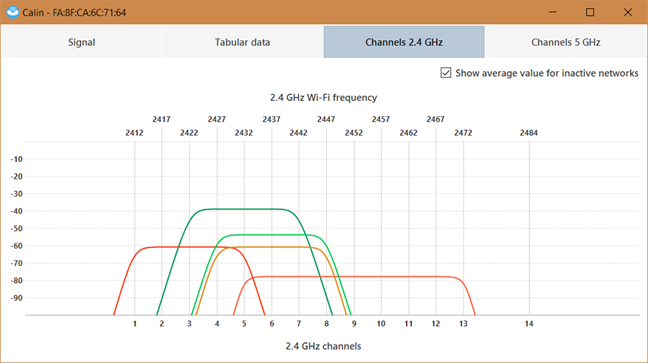
Then, you can access the 2.4 GHz and 5 GHz bands, to see the channels used by the networks that you selected, and how they overlap. This data is useful in improving the settings of your wireless network so that you use channels that are less crowded by other networks.
All the free features make NetSpot an excellent app for analyzing the wireless spectrum in your area. You can use all the data it provides to improve the settings of your wireless network, so that you use channels that are less crowded, and improve the location of the wireless router or the access points that emit your WiFi. Using NetSpot, you can see where your wireless signal is weaker, and change the location of your router or wireless access point, so that you get better signals strength.
The free version is perfect for home use, or for small businesses with wireless networks that include a few wireless devices. When you need to analyze a large area with many wireless access points, or a multi-floor home, you should purchase the PRO version which ads several useful features, for analyzing complex wireless networks.
NetSpot Pro unlocks advanced visual analysis and hundreds of data points
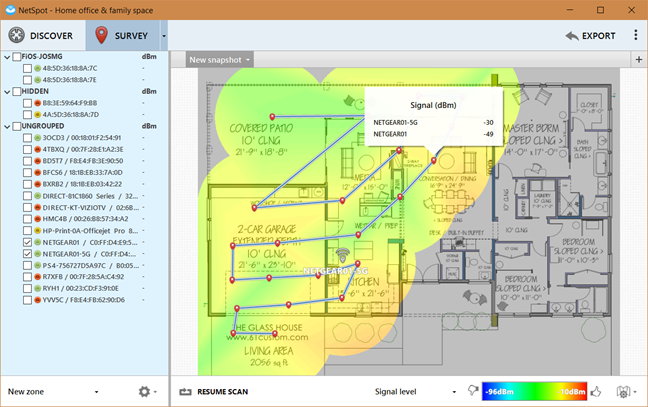
The Pro version of Netspot unlocks several features that are useful for more advanced setups. You can use the Survey tab to load a floor plan of your area, and then conduct measurements in several locations. The plans can be in any image format you desire, from BMP to JPG to PNG, and so on. You get to see how the wireless signal evolves in a location, across floors and rooms, in a visual way.
You can also view other useful data like the signal to interference ratio, the number of wireless access points, the download speed, the wireless transmission rate and other data.
The NetSpot Pro app makes it easy to view weak spots in your network so that you can take measures for improvement. The Pro version can be used to analyze 50 zones per project, take up to 50 snapshots of data, and use up to 500 data points per heatmap. If you need even more data and more measurements, then you are dealing with a highly complex setup, and you need to purchase the Enterprise version of NetSpot.
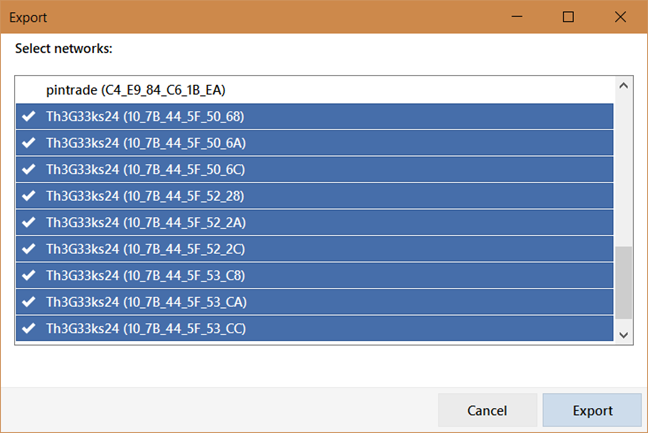
The Pro version allows you to export data from your measurements into PDF, PNG, CSV and other formats. This way you can use the collected data in other advanced tools so that you get the results you want.
Do you like the NetSpot app?
We like the NetSpot app both in its free and Pro versions. If you want to understand the wireless spectrum in your area, optimize your settings and your set up, you should use this app. Try it out, see how it works and comment below. What is your experience with NetSpot? Are you pleased with this app and what it has to offer?


 30.07.2018